Table of Contents
- 1 EOS Explained: The Blockchain That Set Out to Change the Rules – The Original Vision
- 2 The Whitepaper’s ambitious promises
- 3 A Volatile Journey: Price Surges, Crashes, and Strategic Rebrands
- 4 2025: Vaulta’s Rebrand & Market Flurry
- 5 What prompted the trauma?
- 6 EOS vs. The Titans: How and why is it Competitive?
- 7 Where EOS is winning:
- 8 Where EOS is falling behind:
- 9 The Deflationary Gambit: Burning tokens to enhance the Offer Price
- 10 Could this be a successful endeavour?
- 11 Price Estimates Are you certain that we will see EOS hit $1 Or $5, or zero?
- 12 Technical Analysis Snapshot (April 2025)
- 13 EOS Daily Chart Analysis for Long-Term Investors
- 14 Chart Patterns and Price Action
- 15 Expected Price Change (Wave Structure)
- 16 Moving Averages Analysis (EMA 26, 50, 200, and SMA 2,6, 50, 200)
- 17 RSI (Relative Strength Index) Definition
- 18 Fibonacci Retracement Levels for EOS/USDT
- 19 Final Report
- 20 End of Story
EOS Explained: The Blockchain That Set Out to Change the Rules – The Original Vision
Designed to be a very quick and effective blockchain for handling decentralized applications (dApps) to address the scaling issue (speed, security, and decentralization) plaguing Bitcoin and Ethereum, EOS.
Important attributes:
- Scalability: Far beyond that of Bitcoin and Ethereum’s base layers, it can handle thousands of transactions per second (TPS).
- Zero fees: EOS users can stake tokens, maybe making it the best platform for micromoney transactions, thereby avoiding a cost per payment.
- Flexibility: Blockchains can assist in classifying their capacity to be applied across sectors by supporting a wide range of various uses, including DeFi and gaming apps.
- DPoS Consensus: Although delegated proof-of-stake (DPoS) was selected above other consensus candidates for its transaction speed, it has been criticized for centralization security concerns, as only 21 block producers could validate transactions.
The Whitepaper’s ambitious promises
- The EOS whitepapers exhibit multiple statements and promises:
- “Millions” of TPS (although in early stages, more than Ethereum and Bitcoin).
- No-cost transactions (by simply staking and removing costs).
- Governance on-chain (where token holders can elect block producers, which gives some level of independent decisions).
Was it achieved? Although EOS is better tokenized and scaled than Ethereum previously, since centralization and governmen,t and governance issues have impacted the EOS run.
A Volatile Journey: Price Surges, Crashes, and Strategic Rebrands
- From a $4 billion ICO up to SEC Fines: The ICO for EOS in 2017 received 4 billion dollars which was the largest ICO, to this day, at the time of fundraising. But the SEC came in quickly. In 2019, they handed down a fine to Block One (the maker of EOS) of 24 million dollars for conducting an unregistered offering of securities. The legal aspect has been a drastic blow to the credibility of EOS.
- Confidential Alert: There were also class action lawsuits and a $27.5 million settlement that the courts dismissed as “inadequate.” Then, there were the governance scandals, including proof of collusion by block producers (BPs) as well as arbitrary account freezes that called EOS’ decentralisation assertions into question.
2025: Vaulta’s Rebrand & Market Flurry
In March of 2025, EOS became Vaulta and transitioned to the world of Web3 banking in a wider DeFi space. The market response happened almost a moment later:
The price jumped to 50% or more over $0.67.
But soon after, the bubble quickly burst to a price of $0.48 in April of 2025.
What prompted the trauma?
- Hype vs. Reality: It was ultimately speculative buying, and some will ultimately profit. Once traders thought that the trading no longer looked promising, they pocketed a drop.
- Competitors to Ethereum’s layer solutions and throughput, as well as Solana’s throughput, are always top of mind, and the Blockchain is waiting for Ethereum to go bankrupt with crazy.
EOS vs. The Titans: How and why is it Competitive?
Let’s look at some of the major attributes of EOS and its competitors:
| The Feature | EOS | Ethereum | Binance Smart Chain | Tron |
| Consensus | DPoS | PoS (Eth 2.0) | PoSA | DPoS |
| TPS | 4,000+ | ~100 (pre-L2) | ~300 | 2,000 |
| Fees | Zero | High gas fees | Low ($0.01) | Near-zero |
| Governance | On-chain | Off-chain EIPs | Binance-controlled | Super Reps |
Where EOS is winning:
- No costs for transactions, making it very favourable for micro-transactions and DeFi
- Hugely scalable, with tons of throughput (and better than the base layer of Ethereum)
- Developer-friendly, as smart contracts are created using C++, helping establish active developer communities
Where EOS is falling behind:
- The centralization element of a smaller number of Block producers (only 21).
- Legal baggage from prior SEC litigations and fines.
- Dominance of the network and ecosystem size of Ethereum, since it is EVM compatible, is larger than that of EOS.
The Deflationary Gambit: Burning tokens to enhance the Offer Price
EOS has also chosen a potential route of deflation to deal with the rising cost of living by burning tokens.
- 34 million tokens were burned from the Ethereum ICO. This shows the company is serious about decreasing the total number of tokens in circulation.
- Plans are made with an 80% future supply reduction timeline with a hard cap not to exceed 2.1 million tokens.
- Burning has occurred with the EOS EVM fuel costs and has been rolled into the deflationary model.
Could this be a successful endeavour?
If demand increases with scarcity, burning tokens will drive up the price. However, if we are in a slow time for adoption, and burning tokens are not even close to satisfying demand, they will not achieve the price prerequisite.
Price Estimates Are you certain that we will see EOS hit $1 Or $5, or zero?
Analysts are very much divided in their future expectations for EOS:
- 2025 Predictions: Predictions range from $0.90 (CoinPedia) on the conservative end to $2.35 (bullish Case).
- 2030 Predictions: A few collective predictions up to $7 and significantly more if Vaulta’s Web3 banking model works.
- Historical Check: Past Results and Future Results. As with many altcoins and coins, because of the constant changes in the cryptocurrency marketplace, EOS’s future is dependent on its future adaptability and performance when it eventually faces competition.
Technical Analysis Snapshot (April 2025)
EOS Daily Chart Analysis for Long-Term Investors
-
Chart Patterns and Price Action
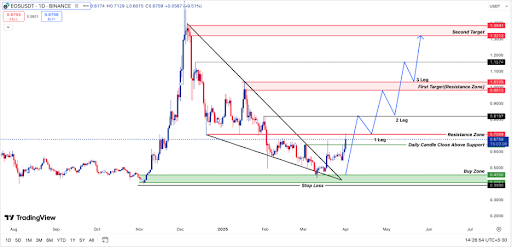
- The fall wedge pattern (black trendlines) has been broken. This may signify the potential for a bullish reversal.
- Price closed above 0.7069 USDT. 0.7069 USDT zone of resistance, implying the market can hold more upward strength.
- The buy zone that ranges from 0.3900 to 0.4550 USDT is where it received solid support. This suggests the potential for a sustained trend upward.
-
Expected Price Change (Wave Structure)
- Breakout of the wedge
- Second Leg: Pullback to test previous resistance for support.
- Third Leg: Strong effort to raise resistance levels.
- Key Price Levels
- Soon, resistance is 0.7069 USDT (now a good resistance level).
- First Ziel (Resistance Zone): 0.9813 – 1.0329 USDT.
- Second Ziel: 1.3213 – 1.3841 USDT.
- Risk Management
- Stop Loss Below 0.3900 USDT (strong zone of support).
- Bulls Daily candle confirmation that closes at, or higher than, 0.7069 USDT is a powerful bullish signal of the currency.
The technical analysis shows that EOS may be set for a bullish breakout and has a target price ranging from 0.98 USDT to 1.38 USDT.
Moving Averages Analysis (EMA 26, 50, 200, and SMA 2,6, 50, 200)
EMA 26 Vs. EMA 50: If EMA 26 exceeds EMA 50, it is an indicator of a short-term uptrend. On the other hand, if EMA 26 is lower than EMA 50, then there is a weakness in the market.
EMA 50 and. EMA 200 (Golden Cross or Death Cross): EMA 50 crossing the EMA 200 and giving the Golden Cross signal is a major event, which is a signal of a change of the trend from bear to bull.
SMA 200 is rising and higher than SMA 200, which shows the bullish long-term trend, or vice versa – SMA 200 is below and falling, which is bearish.
RSI (Relative Strength Index) Definition
- If RSI is > 70: Overbought (potential for an eventual pullback).
- RSI between 50-70: This range is considered safe for the upward momentum of the stock market, and it is the most unpredictable zone for the bears.
- Between 30-50 RSI: This is the critical period when the stock is undergoing a bearish phase and can switch to a bullish one at any time.
- RSI > 30 Oversold (potential for bounce).
Fibonacci Retracement Levels for EOS/USDT
- 0.236: $0.7350 USDT (First minor resistance).
- 0.382: $0.8350 USDT (Watch for a possible pullback).
- 0.500: $0.9100 USDT (Key Mid-point and breakout level).
- 0.618: $1.0200 USDT (Major goal, high resistance).
- 0.786: $1.1500 USDT (Near 2nd target in this chart).
- 1.000: $1.3800 USDT (Full trend reversal area).
Final Report
MAS Positioning (EMA 26 50, 200, and SMA 26, 50, 200), re-adding the direction of the trend. RSI analysis: RSI increases speed above 60. A reading below 50 is a sign of vigilance. Fibonacci level: 0.7350 with USDT -major resistance between 1.02 USDT. A break on 1.15 USDT may indicate a complete tendency reversal.
End of Story
EOS is a risky and high-reward investment. If Walta’s change in web3 banking is successful, EOS may climb. In this phenomenon, it may risk being like many lost veterans within the unstable cryptocurrency market.